We recently conducted a study examining benchmarks and trends associated with loyalty and engagement among mobile app users. In this article we discuss the findings associated with Loyalty. In a second article we present and discuss the findings on engagement.
Establishing performance benchmarks is an important aspect of mobile marketing. Whether you’re marketing multiple apps for a major company or focusing on the flagship app of a prominent brand or indie studio, internal benchmarks give you the ability to gauge performance and understand the evolution of your user base over time.
In addition to measuring performance against internal benchmarks, it’s also helpful to compare against external benchmarks, as this enables you to identify areas of relative strength and weakness and modify your campaigns to remedy inadequacies.
Loyalty and Engagement Study
We recently conducted a study designed to provide benchmarking insight into two essential mobile marketing measures of success: loyalty and engagement. For the purposes of the study, we defined Loyalty as opens per install, and Engagement as events per open.
We analyzed data associated with the 100 most popular apps (based on the number of total installs) in each of the following categories: Games, Music & Entertainment, Social, Utilities. We also examined the data by acquisition channel (i.e. organic and paid). Data was associated with a user cohort that installed an app from one of the targeted categories during April 2015.
This article includes graphs and observations that can help you identify how your apps measure up against others in the industry, as well as recommendations for ways you can increase loyalty and engagement in your own apps.
Loyalty
Loyalty (opens per install) is an important metric because it acts as a leading indicator for all other metrics. If users aren’t opening your app, they’re also not engaging in any other goals or outcomes you’re interested in measuring. High loyalty indicates that users are incorporating your app into their habits.
In each of the graphs that follow, loyalty trends are presented as a percent of day one opens. For example, if an app was opened 1,000 times on the day of the install, fell to 650 week one opens, and 350 week six opens, the correlating percentages would be 100% (install date), 65% (week one) and 35% (week six).
It’s important to note that over the course of six weeks, the total number of active users is declining (i.e. a smaller number of users is responsible for a larger percentage of opens).
Loyalty by Category
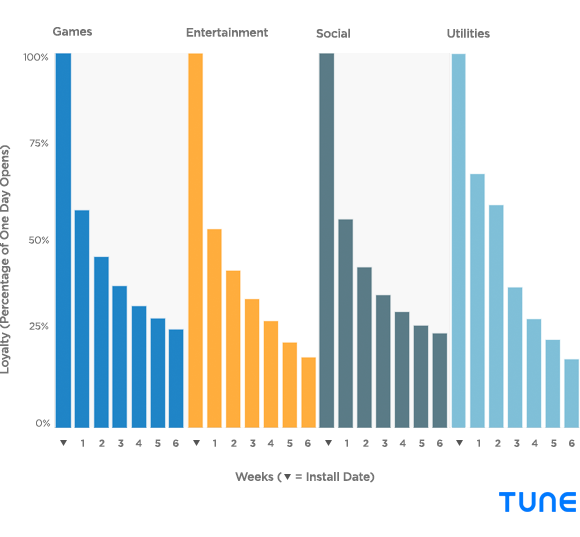 Top performer: Utilities edged out Games by 1% to claim the top spot for loyalty (based on average loyalty over six weeks). Utilities is particularly strong in the short run (weeks 1-2), while Gaming has higher loyalty in the long run (weeks 3-6).
We were also interested in learning how loyalty trends change based on operating system and whether a user was acquired through organic or paid channels:
Loyalty by Operating System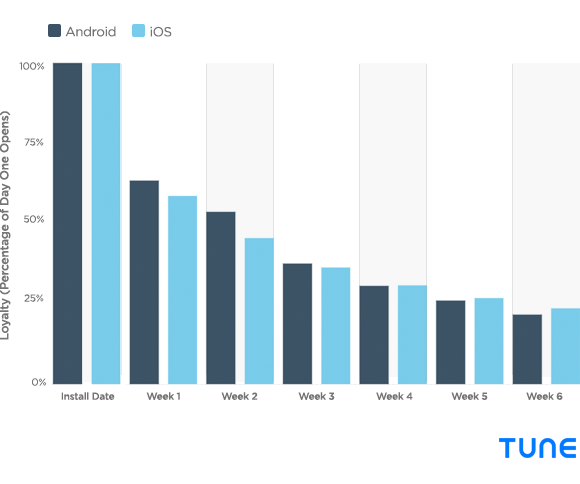
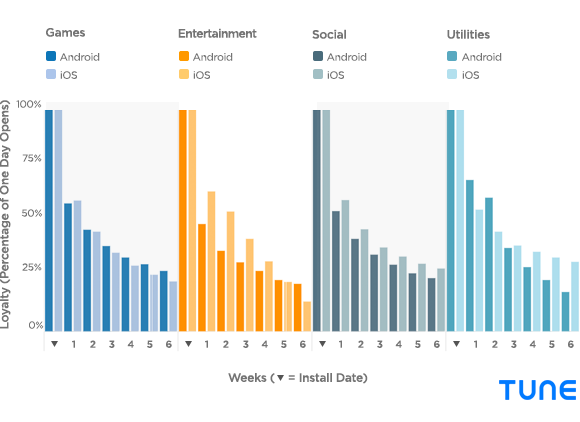
Loyalty by Category and Operating System
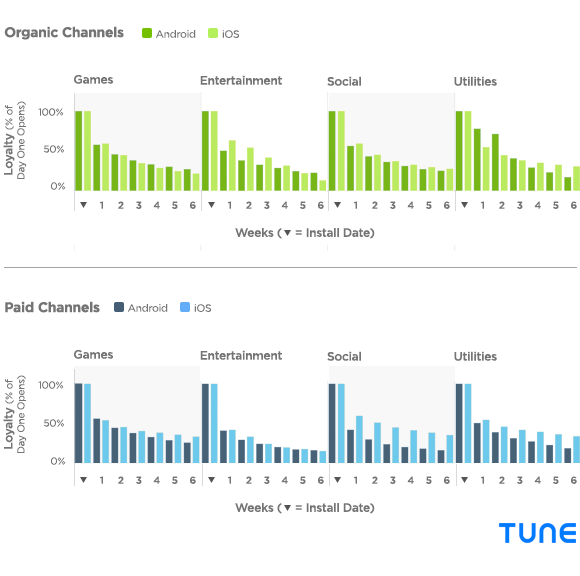
Loyalty by Category and Channel (Organic and Paid)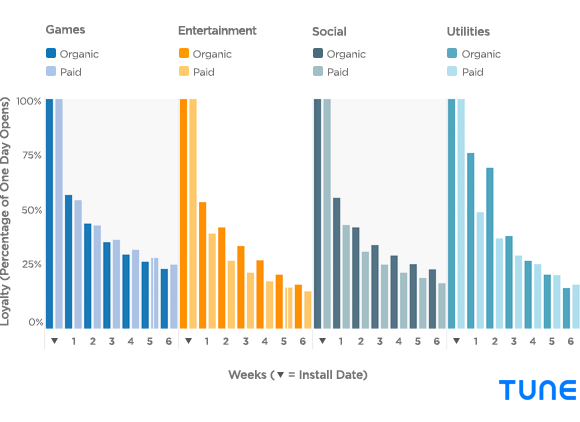
Loyalty by Category, Operating System and Acquisition Channel (Organic and Paid)
Observations
User attrition is a challenge for even the most popular apps. Loyalty across all categories fell an average of 41% by the end of the first week and 78% by the end of week six.
Takeaway: As a mobile marketer, your strategies should be designed to encourage loyalty. Dig into your data to find the ideal time to bring users back into your app.
For example, in the Loyalty by Category graph, Utilities apps see a relatively large drop in users after the first two weeks. If you drill into Utilities data further (see the Loyalty by Category, Operating System and Acquisition Channel graph), you can see that this drop is heavily influenced by the decrease among organic Android users after week two. This critical time period (between week two and three) may be the perfect time for Utilities apps to target organic Android users with a re-enagement campaign, encouraging them to return to the app.
Organic on Android, paid on iOS. Across all app categories, by the end of six weeks organic Android users were more loyal than Android users acquired through paid channels in three out of four categories (Utilities the lone exception). Interestingly, the opposite is true on iOS as loyalty at the end of six weeks is higher across all categories among paid users than it is among organic users.
Takeaway: Identify your most loyal users and determine how they were acquired. In your day-to-day marketing activities it can be easy to inadvertently focus on install volume, instead of focusing on quality. Acquiring users through organic channels is great (because they’re free), but if your most loyal users are coming through paid channels, don’t be afraid to spend.
Other category and channel standouts:
Paid Social: Social app users acquired through paid channels averaged 20% higher loyalty on iOS than on Android over the course of six weeks.
Utilities: Although Android Utilities users initially show more loyalty, by the end of week six, paid and organic iOS users open utility apps an average of 14.5% more frequently.
Engagement
Up next, we analyze engagement benchmarks and discuss observations and key takeaways that can help you create a more active user base. How do your apps measure up? Check out this article on benchmarks and engagement.
Like this article? Sign up for our blog digest emails.
Author
Becky is the Senior Content Marketing Manager at TUNE. Before TUNE, she led a variety of marketing and communications projects at San Francisco startups. Becky received her bachelor's degree in English from Wake Forest University. After living nearly a decade in San Francisco and Seattle, she has returned to her home of Charleston, SC, where you can find her enjoying the sun and salt water with her family.


Leave a Reply
You must be logged in to post a comment.