Top mobile publishers like Supercell, Machine Zone, and Kabam didn’t get to the top of the revenue charts by accident. They create amazing mobile experiences, they spend serious cash on user acquisition, and they optimize every single piece of the ad-spend ROI puzzle.
 A little optimization can have a huge impact.
For instance, a 10% cost optimization could save top publishers $500,000 a month on ad spend. Alternatively, optimizing revenue per install by 10% could add $36 million/year in black ink to spend on development, marketing, or free massages for hard-working mobile engineers. This is massive, and it’s one of the reasons that conversion experts call optimization “free money.”
Of course, your budgets and revenue may not be quite as stellarific as King or Electronic Arts, but that’s an even better reason to optimize every last penny. Want to optimize like the big boys? Here’s how:
1. Define and check your lookback windows
A lookback window is a time frame within which you’ve agreed to pay for mobile installs. (You did set up lookback windows when you contracted with your mobile advertising partner, right?)
Now simply check for installs that fall outside that window, whether it’s 10, 30, or 45 days. Here’s an example of a TUNE lookback report:
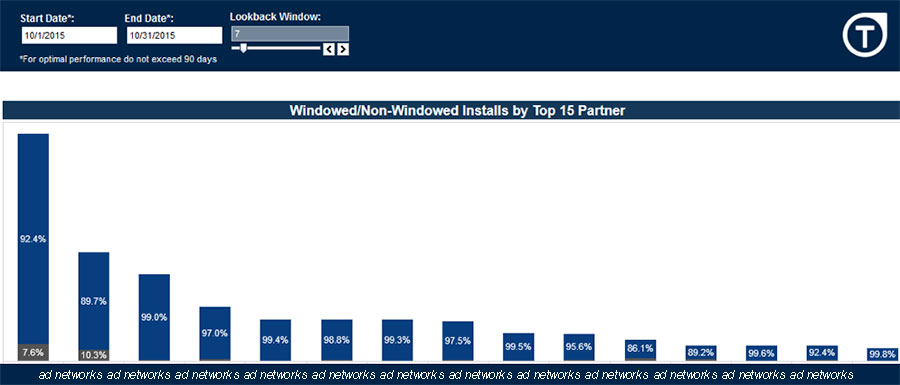
Lookback window report (note: dummy data, ad networks names obscured)
If you find installs that are outside the window, you’ve got something to chat about on your next call with your account manager.
Perhaps more interestingly, you can also test how different lookback windows for various different ad partners impact your conversion rate and user acquisition costs.
2. Measure multi-touch attribution
Customer journeys are complex. Sometimes, so are app install pathways.
It’s pretty clear why if you just check your own buying or app-installing psychology. You’re unlikely to install an app when you first hear about it, unless it comes with a stellar recommendation from a trusted friend or acquaintance, and scratches an itch you possess. But the second time, you might be a bit more likely. The third time, even more so.
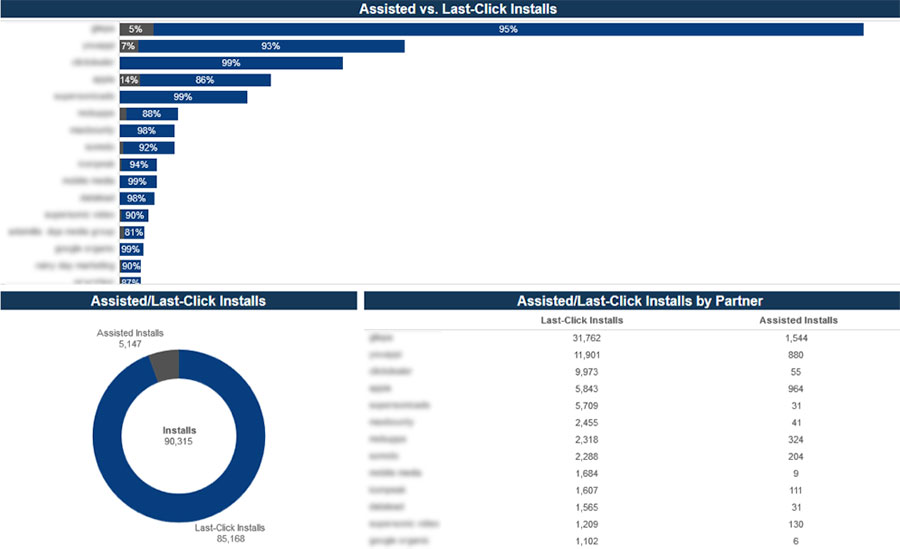
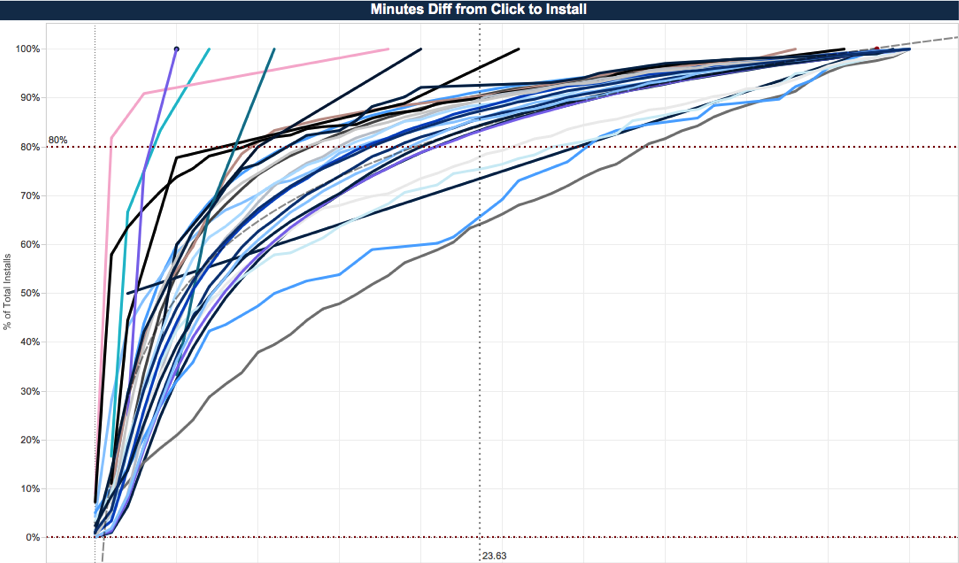
Multi-touch attribution report (note: dummy data, ad network names blurred)
It’s important for you to know how many impressions it takes to optimize your users’ journey from never-heard-of-it to can’t-get-enough-of-it, and a big part of that is the app install invite to completed install. Does it take two ads? Three? Five?
Perhaps even more importantly: which ad networks are helpers, and which are finishers? Both are important, and both can be necessary. Seeing the data gives you a better picture of what’s actually happening, and makes you smarter in future negotiations as well as partner selection.
In addition, this report can show you instances of double-charging, where you’ve been charged twice for the same install.
3. Use audience lookalikes to find the right users for you
Your most profitable users might be multi-ethnic urban city-dwellers. They might be Spanish speaking. Or they might be rural farmers and ranchers. Whatever they are, you want to find more of them.
Use an audience look-alike model to show common properties of your most engaged users, and then allow you to target audiences with similar properties. That gives you a double whammy: eliminating wasteful spend, and targeting users who are most likely to convert.
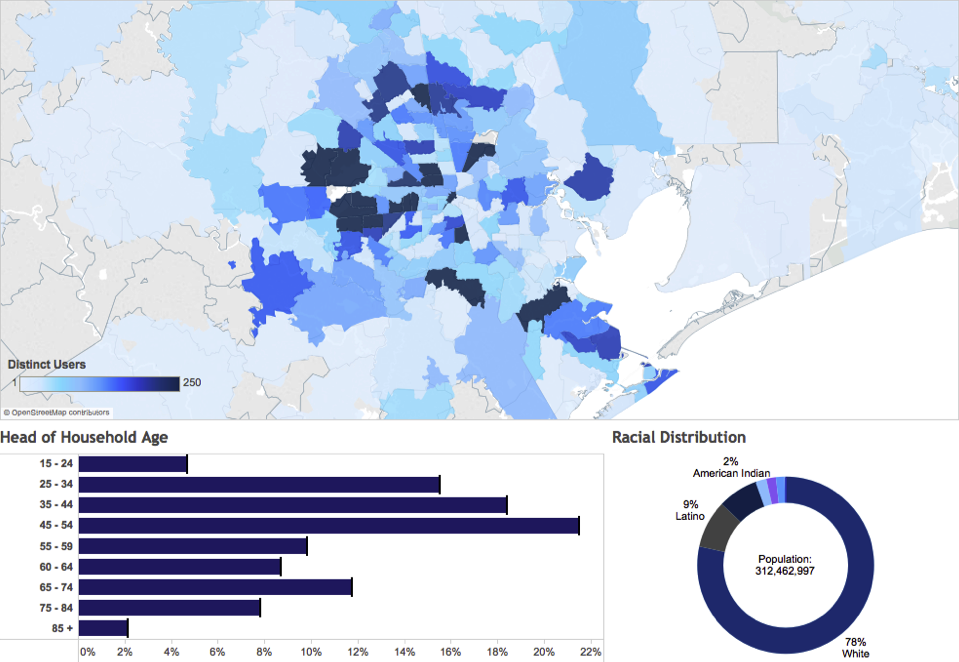
Audience look-alike report (note: dummy data)
For example, one dating app wanted to target men of a certain age, demographic profile, and economic status. This report helped them find the right people, and avoid targeting audiences that were more likely to contain women.
4. Measure attribution down to zip/postal code
Lookalikes are great, but sometimes you want to go by region as well. Use regional attribution reports to measure installs right down to the international postal or zip code to again target users who look like the best users you already have.
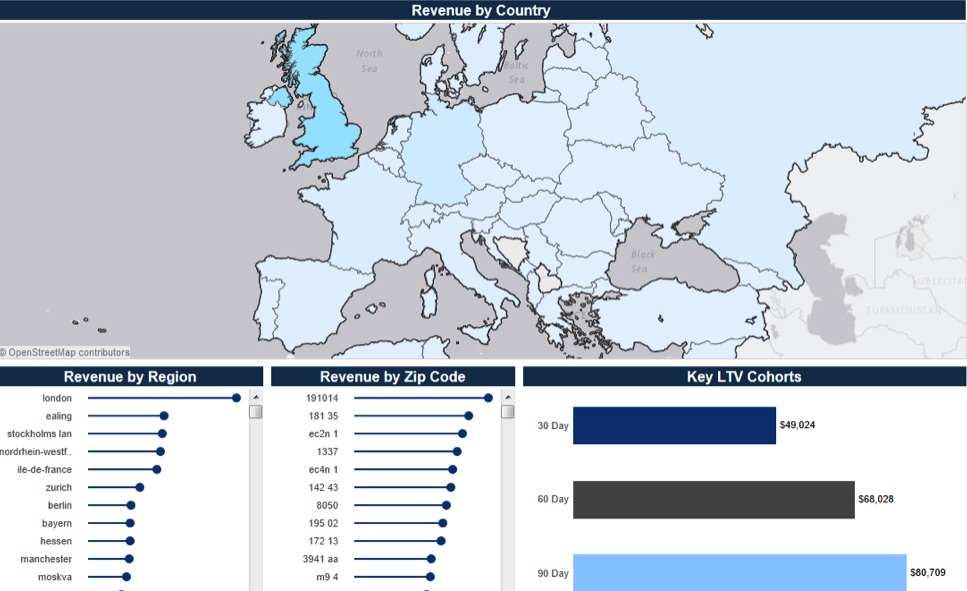
Revenue by country report (note: dummy data)
Now you can slice and dice conversion, engagement, ROI, and LTV at a very tight regional level, and then segment your potential customers or users even further on nearly any attribute.
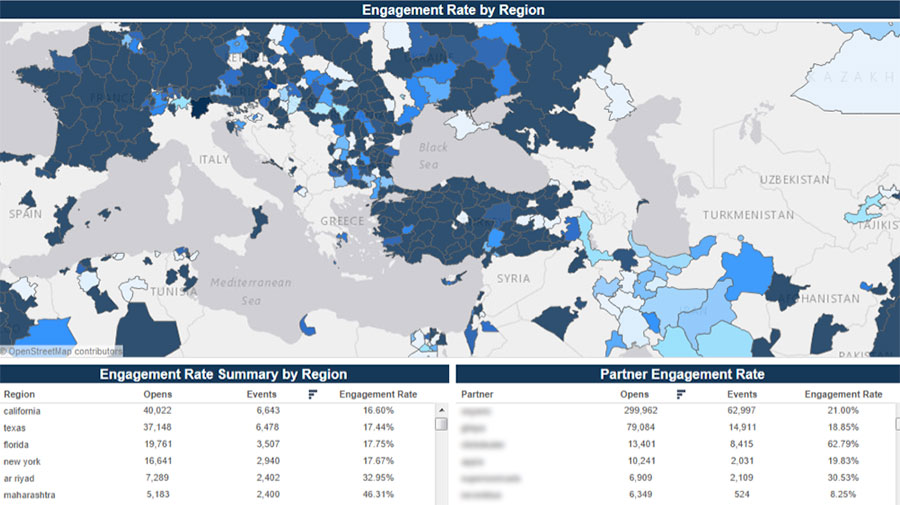
Engagement by country report (note: dummy data, ad network names obscured)
Here, for example, is your engagement rate by international regions; useful information for app marketers wondering where to focus their dollars and attention.
5. Measure re-engagement ROI
Most mobile users actively use 5-8 apps daily, with perhaps 10-20 more that they might use weekly, and a higher-yet number monthly. And some apps just live on their phones like zombies, there, waiting, but never actually used.
If you’re not Facebook, Google, or a top game publisher, chances are your app is in one of the weekly, monthly, or (hopefully not) zombie categories. So re-engagement is a must: ads that ping users about new features, new products, new deals, or new functionality in your app, which they have already downloaded.
But you have to know your ROI.
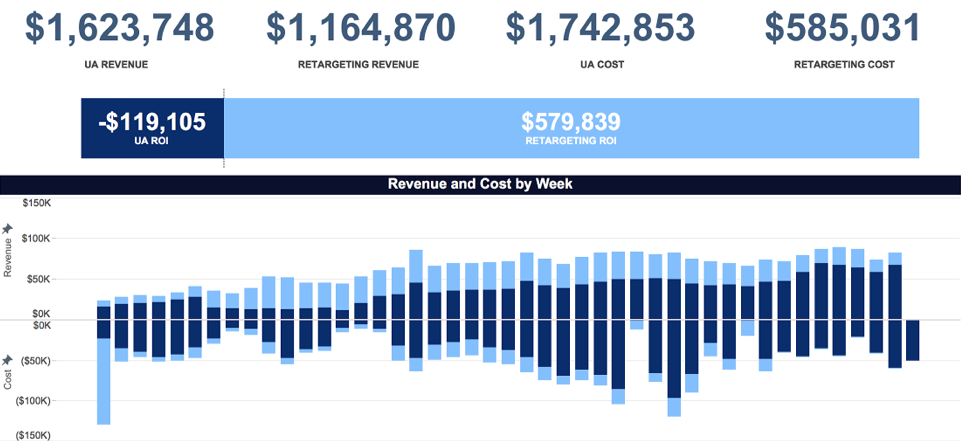
Re-engagement ROI report (note: dummy data)
Your re-engagement ROI report tells you how much you’re spending and how much you’re making. This is particularly important as your userbase matures.
6. Evaluate attribution models
Not all ad partners need to be on an identical attribution model, and mobile marketers should definitely consider different attribution models for different ad types. For instance, video ads and banner ads are not the same, don’t get the same level of engagement, and have widely divergent ability to impact behavior.
Attribution model report (note: dummy data)
So attribution model reports can give mobile marketers a better sense of which models might be best in which situations.
For example, you might choose linear attribution, where each interaction gets equal credit, time-decay based attribution where more recent interactions get more credit than older ones, or position-based attribution, with perhaps 40% goes to the first interaction, 40% to the last one, and 20% to the middle.
7. See the forest… and the trees
Mobile marketing is complex enough. Your reporting should simplify, not exacerbate the challenges. So a report that combines data from all your partners and all your organic installs, measure them at the most granular level, and also present you with a 30,000-foot executive summary is critical, as is the ability to dive into detail on a per-partner basis.
Ultimately, the goal is simple: sorted, organized, and structured information at your fingertips so that you make smart, data-driven decisions.
Just getting started? We can help.
Like this article? Sign up for our blog digest emails.
Author
Before acting as a mobile economist for TUNE, John built the VB Insight research team at VentureBeat and managed teams creating software for partners like Intel and Disney. In addition, he led technical teams, built social sites and mobile apps, and consulted on mobile, social, and IoT. In 2014, he was named to Folio's top 100 of the media industry's "most innovative entrepreneurs and market shaker-uppers." John lives in British Columbia, Canada with his family, where he coaches baseball and hockey, though not at the same time.


Leave a Reply
You must be logged in to post a comment.