Now that we have rung in the new year, we have the opportunity to look back on the fiscal year 2013 and begin to flush out the vast, and still relatively unknown, landscape of the mobile world. In particular, we will evaluate the high-octane shopping frenzy that we know here in the US as the “Holiday Season” which is comprised of 7 main events: Thanksgiving, Black Friday, Cyber Monday, Christmas Eve, Christmas Day, New Year’s Eve and New Year’s Day.
Before we do so, let’s take a look at the mobile landscape as we know it currently.
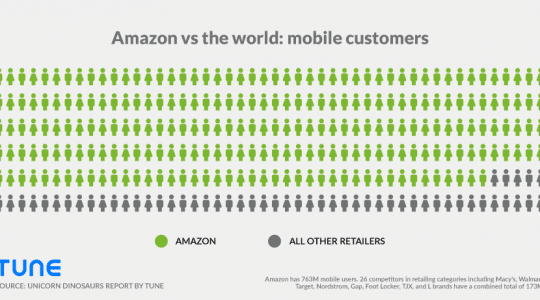
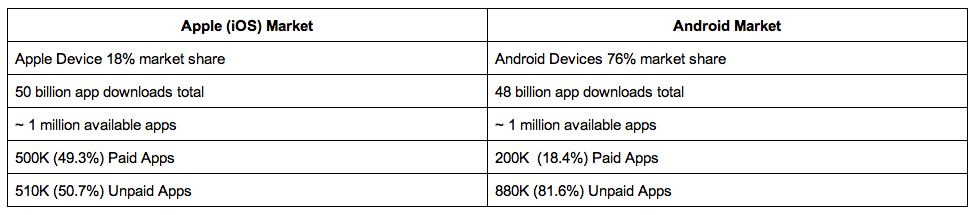
As most of you already know, mobile is dominated by two entities – Apple/iOS and Android – that take up the lion’s share of the market and its subsequent revenue. Perhaps no surprise there, but it is far more complicated a relationship and to understand their related statistics (well, any statistics for that matter) we must always understand the environment on which they are predicated.
The Current (or Most Current) State of Affairs
Now that we understand the current lay of the mobile land, we can delve into our data set and research parameters. We randomly sampled over 1000 of our MobileAppTracking clients, over 10,00 applications, analyzing hundreds of millions of events & installs from 10 app categories over 8 distinct days during the 2013 holiday season. As app categories in the iOS and Android app store do not always use similar naming conventions, we aggregated categories that relate to one another; e.g. Transportation (iOS) + ‘Travel’ (Android) = ‘Travel and Transportation’.
The main metrics of interest were overall Revenue (a total of revenue generated both by downloads and in-app purchases), Install Rates, and Event Rates (in app events, excluding opens & closes). We did not think it viable to compare the 2013 holiday season with that of 2012. Instead, we chose to use an average of the entire 2013 fiscal year as the benchmark to which we compared our data.
Summary Findings at a Glance
-
Overall revenue is highest on Black Friday – attributed for 16.4% of all revenues earned across 8 days
-
Overall number of installs is highest on Christmas Day – attributed for 22.5% of all installs across 8 days
-
There were the most events tracked on Christmas Day – attributing for 15% of all events
-
Compared to the FY13 average, Black Friday and Christmas Day have the highest variance from the average
-
Christmas days installs are greater than the FY13 average by 2.5X

Operating system: iOS vs Android
-
Christmas day saw the highest conversion rate on installs per ad click, with 34 installs per 100 clicks on iOS, and 21 installs per 100 clicks on Android. Due to its high conversion rate, it would be cost effective to increase investments in ad campaigns for Christmas Day.
-
Black Friday is the highest total revenue day (iOS and Android combined); for iOS alone it is nearly double the FY13 average

Revenue by Category
-
Gaming category (seen here in blue) dominates revenue across these 8 days
-
Gaming contributes to over 50% of the entire generated revenue across all app categories, followed by Lifestyle (30%) and Business & Finance (10%).

Revenue by Holiday Event
-
Black Friday and New Years Eve had similar numbers revenues, installs and events.
-
Black Friday still led with the greatest amount of revenue, followed by New Years Eve and New Years Day,

Revenue by Operating System
-
iOS contributes to 80% of the revenue during the holiday season across all categories.
Note: This metric can be tricky and is most times misunderstood to mean that, in comparison to the Apple market, the Android market is not a good source of revenue. You have to know what sources of revenue are being discussed as revenue can be generated using several methods with mobile apps, on differing attribution windows and revenue recognition principles. Here we analyzed the revenue that is generated through installs & in-app events. This means we did not include revenue generated by in-app advertising – a very lucrative means of generating revenue for mobile advertisers. Therefore, when it comes to revenue based on app installs and in-app purchases, iOS contributes the vast majority of this type of revenue to the market. Android, on the other hand, generates revenue (and a lot of it) through advertising and this fact is important to keep in mind when discussing any differences in revenue based on platform.

Top 3 Categories – Breakdown
Gaming
-
Strongest revenue across all 8 named days occurred on Black Friday
-
Second highest day was New Years Eve followed by New Year Day.
-
Christmas Day contributed the most installs and events for both iOS and Android.
-
Overall, Gaming installs, events, and revenue were all higher performing during the holiday season than compared to FY13.

Travel
-
The highest concentration of revenue, events, and installs for both Android and iOS occurred on New Years Eve.
- While travel is generally high around holidays, e.g. Thanksgiving and Christmas, such travel consists mainly of flying and very few airlines have their own app which a user can use to check-in or even use as a boarding pass to get through security and board the plane. However, there are a good amount of widely used apps for taxis (e.g. Uber, myTaxi and Flywheel) which allow users to instantly request a taxi to come pick them up from their exact location at any given time. Given that New Years Eve is generally a night for partying and celebrating, taxis are in high demand. The convenience of these types of travel apps makes it easy for New Years Eve goers to travel safely and responsibly.

Lifestyle
-
Highest revenues occurred on Black Friday, followed by Cyber Monday, with these revenues generated primarily from coupon apps.
-
Really, this should come as no surprise. Both of these events exist solely for the purpose of shopping and avid shoppers country-wide wait on pins and needles for the two days during which discounts and sales are the most profound – not to mention that on these days one isn’t encumbered with family activities, parties and overeating.

Highlights:The Stats You Should Take Home With you
-
Black Friday generated the most revenue throughout the holiday season.
- What is the biggest market opportunity to generate revenue during the holiday season? Black Friday. Across the four top app categories, Black Friday was one of the top highest revenue days – generating over 50% more revenue than the FY13 daily average.
-
iOS generates 63% of the install and in-app purchase revenues for mobile apps.
-
During the holiday season in the United States, mobile attributions on iOS apps generated more than 5 times more of these types of revenue than Android apps – with a similar number of events and installs per app category.
-
The Gaming category saw the most gain during the holiday season.
Compared to other app categories, the revenue generated within the gaming category across all days was the greatest.
-
Android developers have a big opportunity to monetize on installs and in-app purchases.
When comparing event and install numbers of iOS vs Android apps, they have comparable numbers but when considering the revenue they generate from them, a larger percentage of iOS apps are actually generating revenue than Android. This means Android apps are seeing a lot of engagement but do not monetize on those activities to the same extent.
But don’t be fooled, Android does just fine when you take into the consideration other revenue channels which, in the end, make it back into an app developer’s pocket.
-
Don’t think of it as Apple vs. Android; it’s really not that simple. Each platform has its benefits and methods of attack and developers the world over should consider that before they make any decisions on what platform their app will run on. After all, if you were an app developer in Asia, there would be very little consideration – Android would win hands down.
-
If you’re not taking advantage of the holiday season here in the US, you definitely should be. In December 2013 alone, Apple reported 3 billion apps downloaded and $1 billion spent in the app store. Who wouldn’t want to be part of that?
Author
Becky is the Senior Content Marketing Manager at TUNE. Before TUNE, she handled content strategy and marketing communications at several tech startups in the Bay Area. Becky received her bachelor's degree in English from Wake Forest University. After a decade in San Francisco and Seattle, she has returned home to Charleston, SC, where you can find her strolling through Hampton Park with her pup and enjoying the simple things in life.