First thing’s first. What is a cohort analysis?
Cohort analysis, simply put, is the study of behaviors of groups over time. What behaviors and what groups you ask? “Behaviors” can be any actions you find relevant or that you are interested in. “Groups” are aggregations of data points or users that share a commonality and hence form a cohort.
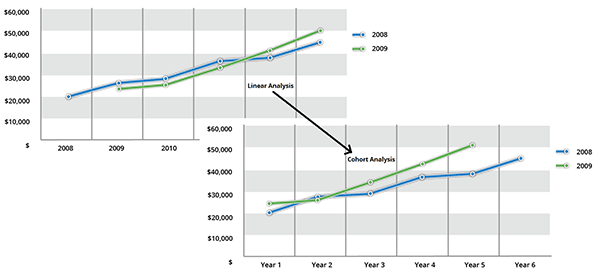
So let us apply this to a very basic real world example. You are interested in knowing the average income over the first five years for college graduates during 2008 and 2009. Traditionally, this information is graphed using a linear analysis graphing the data on an actual-basis (top left graph in the figure below).

When you look at the income on an actual-basis, the average student income is graphed for the year that it occurred – using the date time of the event in the analysis. The top left graph above displays the data based on when the event happened. Using this type of linear analysis, it is difficult to compare one group to the other in order to determine any relationship between year of graduation and income because the timing is not static and the graduating classes are at different points in their careers for each year of comparison.
So consider this same example using cohort analysis (bottom right graph in the figure above). As each graduating group of students is a cohort – they all graduated in the same year and that is their commonality – we can evaluate the average income for each cohort using their graduation year as the initial event (t0) and graph their income relative to each year subsequent to their graduation (t0 +1, t0 +2, t0 +3, etc.).
By using cohort analysis, you are able to evaluate unique cohorts (or groups of customers) with one another for an “apples to apples” comparison that is not possible when using linear analyses. Here, you can see that both graduating classes do increase their average income per year, but that by the third year out, the 2009 grads make more on average (and continue to make more) than their 2008 counterparts.
Secondly, why should you use Cohort Analysis?
By now you can see the benefits of using cohort analysis as a means of extracting meaningful patterns by aggregating data around events to compare previously incomparable data points. If you are still not completely sure, let’s take a closer look and see how this applies to the mobile app ecosystem (surprise!) as a real world example.
In the mobile app ecosystem, we are mainly interested in the actions users take in reference to a mobile app. In specific, we want to know about the number of installs, opens, clicks, client retention and (on a sad note) uninstalls of any given mobile app. This is where cohort analysis comes in really handy as it provides a very powerful method of evaluating the life cycle of a mobile app.
So, what is a cohort in the mobile ecosystem? A cohort is a group of users that completed a specific action (install, open, uninstall) for the first time within a particular window of time. Given this, we can evaluate a range of data patterns such as the rate of active users as well as set your cohort events to various in-app events to determine further user interaction with your mobile app. The applications are endless!
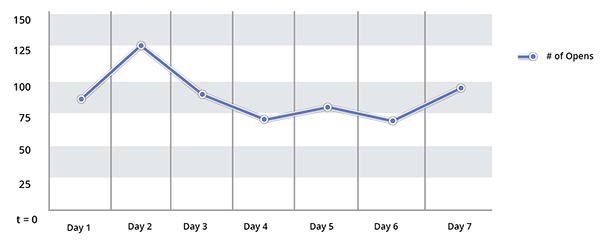
For example, say you want to evaluate the retention rate of the users who install your mobile app. While you can differentiate users who have just installed your app from those who are now interacting with your app using a linear analysis (i.e. installs vs. opens in your actuals report), you cannot determine the overall pattern due to users completing these actions at different times. However, with a cohort analysis you can define a period of time in which you create a cohort of users who completed the initial app install (t=0) and then plot their subsequent interaction with the app, over time (t0 +1, t0 +2, t0 +3, etc.). In the graph below, you can clearly see how often users who have already installed your mobile app (your cohort) interact with it during the subsequent seven days after install (analysis).

Thus, with access to an analysis that has such widespread applicability, you have access to a wide array of cohort reports which allow you to experience your data in new eye-opening ways. Additionally, as a tool used to separate growth metrics from engagement metrics, the cohort analysis allows you to evaluate user behavior over time including the holy grail of marketing, the lifetime value (LTV) for your mobile app.
If you are interested in seeing what cohort analysis can do for your mobile app, feel free to peruse our support documentation (including articles, how-to’s and videos) on the topic.
Author
Becky is the Senior Content Marketing Manager at TUNE. Before TUNE, she handled content strategy and marketing communications at several tech startups in the Bay Area. Becky received her bachelor's degree in English from Wake Forest University. After a decade in San Francisco and Seattle, she has returned home to Charleston, SC, where you can find her strolling through Hampton Park with her pup and enjoying the simple things between adventures with friends and family.


Leave a Reply
You must be logged in to post a comment.