We recently conducted a study examining benchmarks and trends associated with loyalty and engagement among mobile app users. In the first article we discussed Loyalty. In this article we present and discuss engagement.
Engagement is an important metric because it’s a reflection of user activity within your apps. As a reminder, for the purposes of this study we defined engagement as events per open. Like loyalty, engagement is often a leading indicator for other conversion goals. Establishing an active and engaged user base is essential to the long-term success of your apps.
In each of the graphs that follow, engagement trends are presented as a percent of day one events. For example, if Social apps measured 1,000 events on the day of the install, declined to 600 events in week one, and climbed back up to 700 events in week two, the correlating percentages would be 100% (install date) 60% (week one) and 70% (week two).
It’s important to note that over the course of six weeks, the total number of active users is declining (i.e. a smaller number of users is responsible for a larger percentage of events).
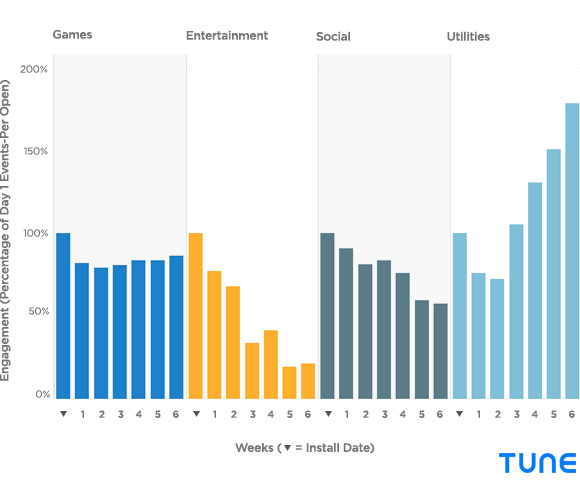
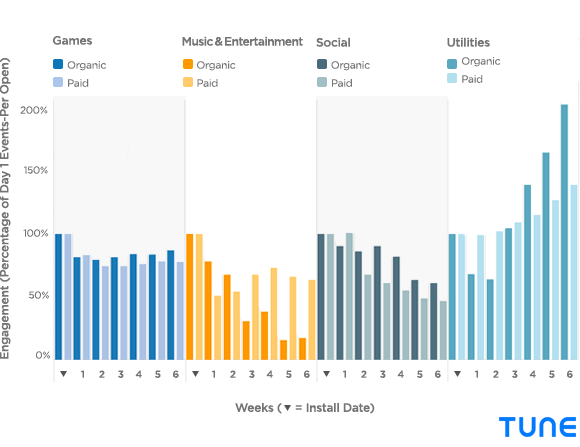
Engagement by Category
Top performer: Strong performance in weeks 3-6 help Utilities dominate other categories in terms of average engagement. Games perform consistently strong over the six weeks, with an average engagement of 82%. But Utilities’ performance down the stretch helps it climb to the top with an average engagement of 118% over six weeks.
We were also interested in learning how loyalty trends change based on operating system and whether a user was acquired through organic or paid channels:
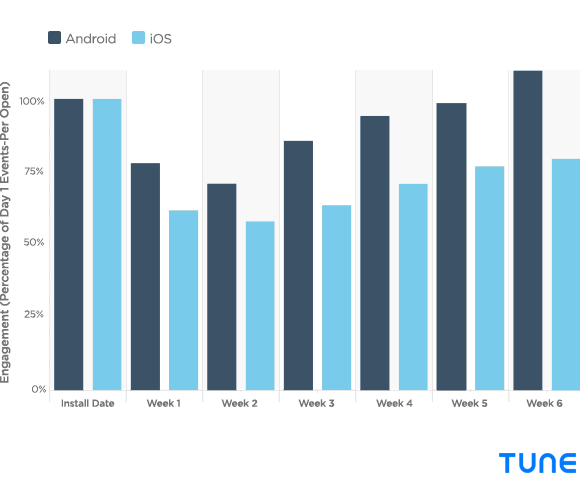
Engagement by Operating System
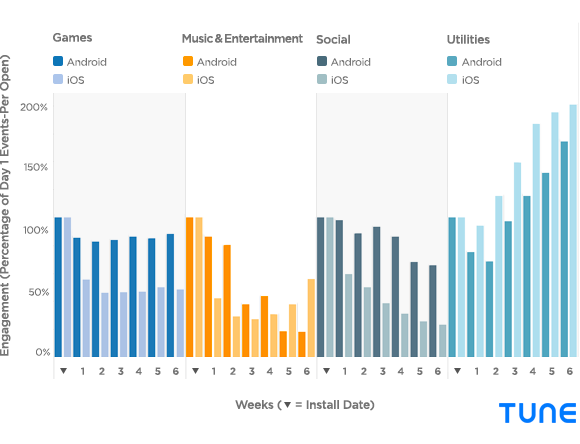
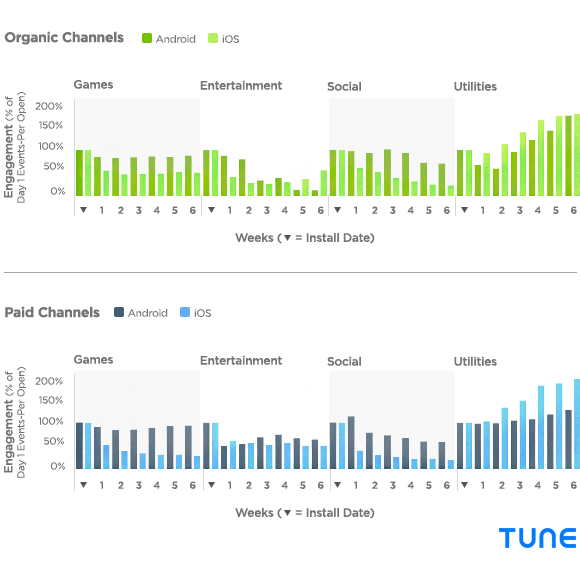
Engagement by Category and Operating System
Engagement by Category and Channel (Organic and Paid)
Engagement by Category, Operating System and Acquisition Channel (Organic and Paid)
Observations
Better week one performance. Similar to loyalty, the largest drop in engagement happened in the first week post install. However, unlike loyalty which experienced an average drop of 41% across categories by the end of week one, engagement saw an average decline of just 19%.
Utilities’ impressive ascent: After declining to 72% during week two, engagement in Utilities apps climbed an average of 27% each subsequent week, topping out at 178% of install date activity during week six. Interestingly, the six week engagement percentage for Utilities apps is highest for iOS users acquired through paid channels, though engagement is also strong among organic Android and iOS users.
Takeaway: Utilities apps are designed to complete tasks, and the engagement trends indicate that these apps might naturally weed out the uninterested, resulting with highly engaged users. A recent TUNE study on the state of app discovery in 2015, found that completing a specific task was the motivation for 23% of all app installs (i.e. a user needs directions so they download a map or GPS app). If your app successfully solves a problem that frequently arises, you should expect engagement to go up over time, driven by your most loyal users.
Week three turnaround. Gaming, Social, and Utilities all experienced an increase in engagement by the end of week three after trending down the previous two weeks. Although the increase was small in two of those instances, week three was a major turning point for Utilities.
Takeaway: Gaining an understanding of the user lifecycle associated with your apps is critical. When you can identify which users tend to drop off and when the decline occurs, you can run re-engagement campaigns specifically designed to connect at just the right moments and bring users back into your apps.
Consistent engagement in Gaming. Engagement across the Gaming category is consistently strong, averaging 82% throughout the first six weeks. However, if you drill down into the data a bit more (see the Engagement by Category, Operating System and Acquisition Channel graph), you can see that engagement on Android is higher than iOS among both paid and organic users. Among organic Android users the average six-week engagement was 85% compared to 51% on iOS, and for paid users the average engagement was 88% on Android vs. 36% on iOS.
Other category and channel standouts:
Paid Utilities on iOS: Engagement on Utilities apps was exceptional across the board, but particularly among paid iOS users where engagement averaged 157% over six weeks.
Paid Music & Entertainment: Engagement among paid Music & Entertainment users averaged 62% over the course of six weeks, compared to 41% among organic users.
Additional insights
In addition to the specific takeaways included throughout this article, there are a few key insights with broad application:
Revisiting the paid / organic narrative: The general consensus across all apps and categories is that organic users – because they sought out the app on their own – tend to be higher quality. The vast majority of apps require both paid and organic users in order to achieve long-term success, but as illustrated there are app categories where paid users were more loyal (Android Games, iOS Social, iOS Utilities) or engaged (Android Games, Android Music & Entertainment, iOS Utilities) than organic users.
As alluded to earlier, it’s highly important to know and understand who your quality users are and how they were acquired, as this knowledge informs how you should allocate your resources.
The magical third week: The data in the apps and categories we examined indicated that you’ve got 2-3 weeks to create loyal and engaged users. Although this window may be different for your own apps, identifying these sensitive time periods should be an important part of your mobile strategy.
To provide a couple examples of how this data might be used, if you’re looking to send a prompt to users to rate your app, the data suggests that right after week three may be the ideal time, as the users that remain at this point are more loyal and engaged, and may be more likely to leave a favorable review. As mentioned earlier, it’s also a great time to reach out to the dormant or marginally active users and bring them back into the app with a re-engagement campaign.
The primary opportunity: Gaming, Social, and Utilities apps have relatively high engagement rates across operating systems and channels. For mobile marketers in these categories, the larger opportunity may be found by increasing long-term loyalty. Loyalty among Music & Entertainment apps could use some improvement, but the primary opportunity lies in increasing engagement.
In summary
As a mobile marketer, establishing benchmarks is essential for successfully measuring app performance over time. While internal benchmarks have significant value, understanding how your apps perform compared to the industry can help you identify areas of relative strength and weakness.
Although the loyalty and engagement trends of each category vary, the transcending takeaway is the importance of identifying user lifecycle patterns and trends in your own apps. Understanding which channels drive the most valuable users and recognizing the time periods most susceptible to user attrition enables you to optimize performance and foster a more active and engaged user base.
Like this article? Sign up for our blog digest emails.
Author
Becky is the Senior Content Marketing Manager at TUNE. Before TUNE, she handled content strategy and marketing communications at several tech startups in the Bay Area. Becky received her bachelor's degree in English from Wake Forest University. After a decade in San Francisco and Seattle, she has returned home to Charleston, SC, where you can find her strolling through Hampton Park with her pup and enjoying the simple things in life.