Welcome to the next entry in a series of articles from TUNE designed to make fraud actionable. Today we do a deep dive into methods of finding and eliminating traffic sources with click fraud indicators.
This continues previous discussions on types of mobile advertising fraud and mobile click fraud impact, detailing the impact of click fraud on your marketing campaign. Click fraud wastes resources, prevents investments in positive traffic sources, and breaks your ability to properly measure other campaigns. The techniques to enable faster elimination of fraudulent traffic are covered here.
Click fraud occurs when clicks are simulated on a real user’s device, even though an ad was not displayed or clicked on. This is a high-return opportunity because it only requires one faked action — the click. Marketers with a large volume of organic users can be especially susceptible.
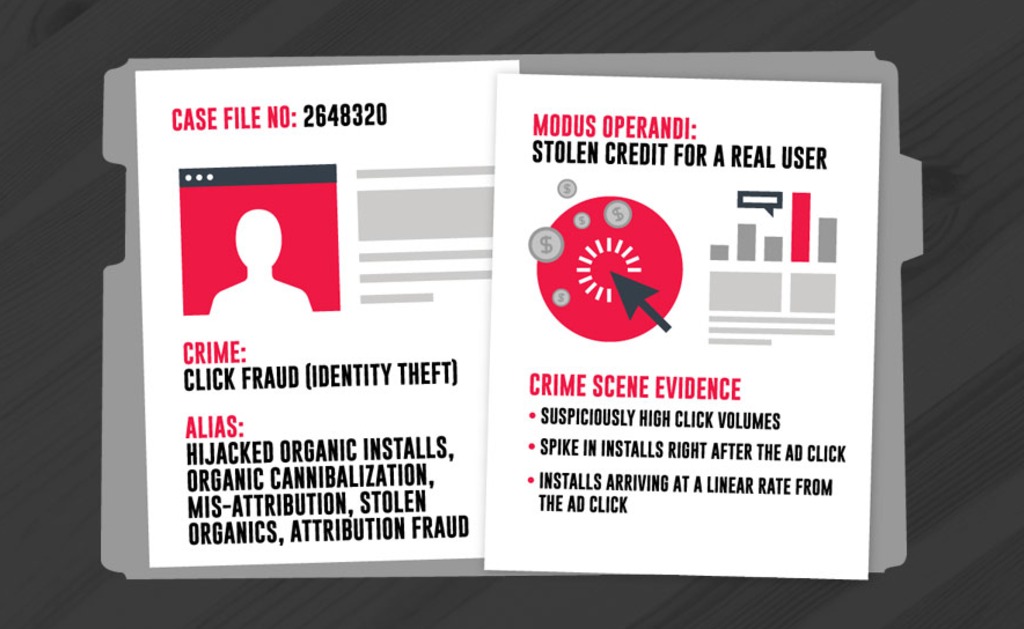
When a fraudster simulates a click on a genuine user’s device, they take credit once the user installs the app on their own. Since the user is a real human with genuine interest in the app, they behave like the typical organic user and don’t raise a red flag based on activity, LTV, or ROAS.
Core to the analysis and detection is understanding the actors/systems in place:
- Click timing is generated by the fraud system, and not the real user.
- Install timing is generated by the real user, and not controlled by the fraud system.
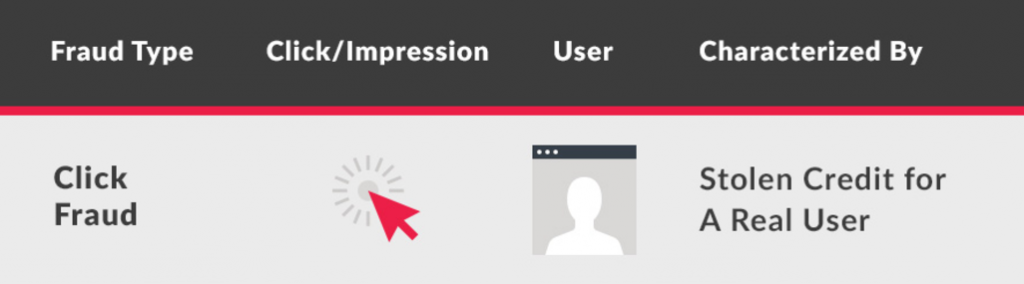
Click fraud recap: In the chart above, red indicates fake and gray indicates genuine.
Time-to-Install Measures Ad Impact
Time-to-install is the time difference between ad click and app install/open, and is a direct measure of the impact of advertising. It can also be known as time-to-action, as in TUNE’s Time-to-Action report.
Effective ads create an action by the end user (a click), with an intention (to install). This click-with-intent is the desired outcome of a successful campaign. To understand fraud we will first look at fraud-free traffic patterns.
Fraud-free traffic to understand time-to-install
The actual time-to-install for effective advertising varies because we are dealing with human behaviors. There are a wide variety of human events impacting the time-to-install: an incoming call delays the open, interruptions from work or home, phone issue with connectivity or power, or they simply forgot. In addition, the human could install now with intention to use after work, or later in the day, delaying the open and the time-to-install.
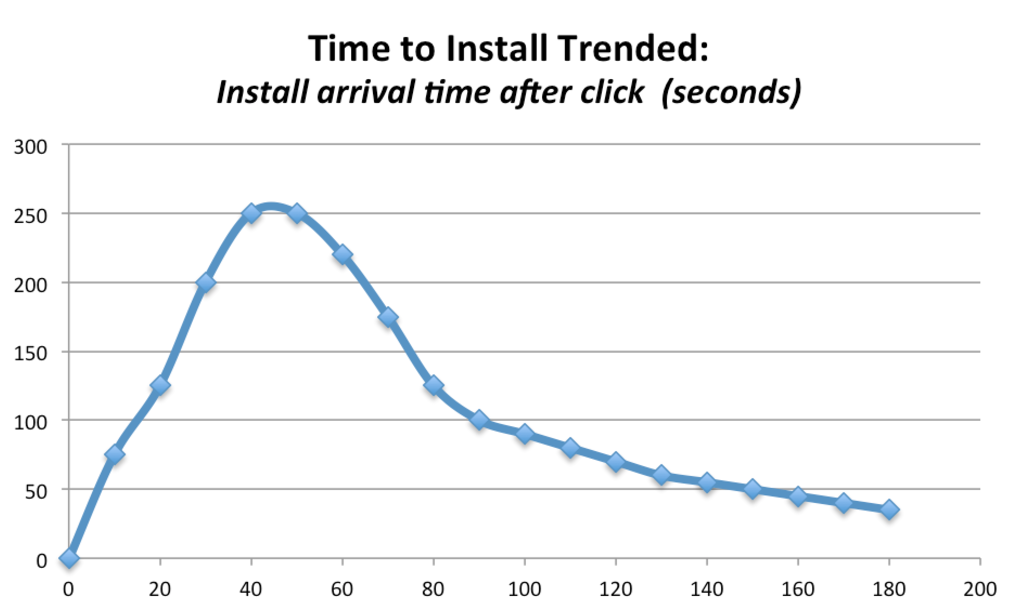
Chart: Typical pattern for fraud-free traffic.
Note that the install time is captured upon first app open. The time-to-install is impacted both by download speed as well as human generated-delays:
TTI = Download time + human time
Example: 120 second TTI = 8 second download + 112 seconds human delays before opening
Key takeaway: The peak is the goal of advertising — driving users to action.
The ideal curve with a strong early uptick in the install rate cleanly shows up in high-quality traffic sources that are free from external fraud sources. Outliers are not fraud in these cases:
- Users on fast networks who open immediately will show very fast install times.
- Users with either slower networks or human events can have much longer time-to-install.
Both very fast, and very slow outliers exist in fraud-free traffic. The existence of these outliers does not, by itself, indicate fraud.
Key takeaway: Outliers exist in fraud-free traffic.
Outlier filters miss the mark
The removal of outliers alone to eliminate fraud is highly problematic. This overly simplistic analysis technique mis-identifies both good traffic and bad traffic. Unfortunately, this simplistic analysis is exactly what happens with much of the fraud detection technology implemented today.
Outliers with fraud-free traffic
For fraud-free traffic, there will still be outliers. Treating outliers as fraud is especially problematic if payment is withheld for legitimate installs from a fraud-free traffic source. Time spent building a use case for a credit or make-good is time wasted.
Outliers with fraud traffic
When fraud occurs there absolutely can be outliers. Both very fast and very long time-to-install use cases can result from different fraud tactics. These outliers are part of the overall patterns to understand fraud traffic.
However, when there is traffic from a completely fraudulent source, most of the installs are not outliers. This is why it is important not to eliminate just the outliers in a fraudulent traffic source.
Key takeaway: Most traffic from a fraudulent source will not be outliers.
Outliers (alone) as fraud prevention
Strike 1 – Unnecessarily eliminates valid traffic
Strike 2 – Fails to eliminate most traffic from bad traffic sources
Strike 3 – Pretends to solve fraud
Spamming and Time-to-Install
Click stuffing and click spamming are both methods that allow for claiming an organic install, or a paid install from another source. However, because the spamming, stacking, or other fraud system is not directly tied to the install and open driven by the human, the time-to-install patterns are completely different.
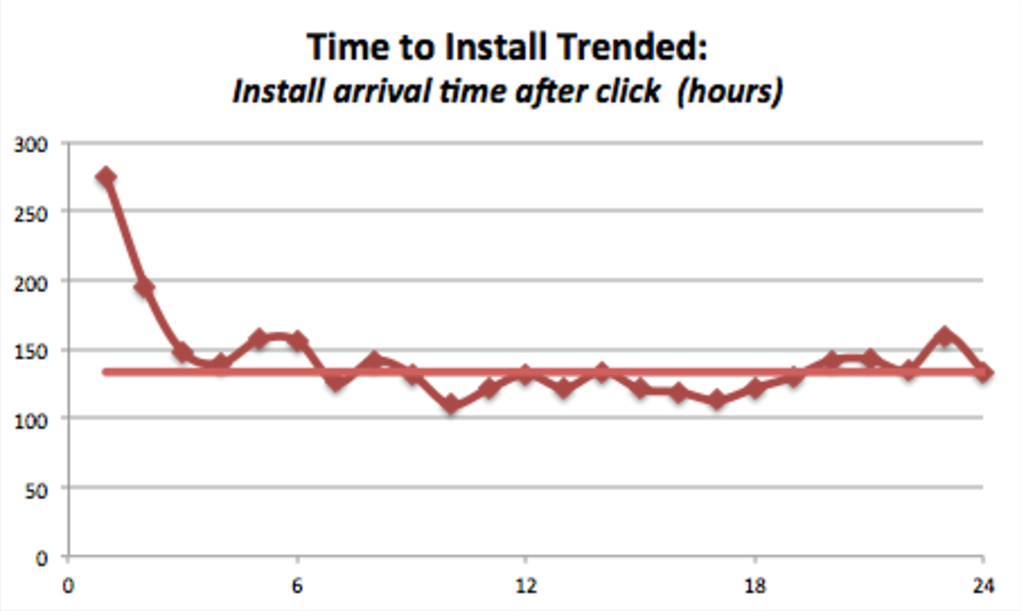
Chart: Real-world traffic with very strong indications of click spamming.
This time-to-install graph shows installs per hour for a campaign that lacks “click-with-intent”. While there is a peak towards the front of this graph, most of the traffic follows the flat line averaging around 134 installs per hour.
Key takeaway: Spamming fraud pattern is a flat line indicating lack of click-with-intent.
Within this graph of 3,411 installs there are:
- 205 installs within the first two hours that demonstrate “click-with-intent”
- 3,206 installs that do not demonstrate “click-with-intent”
The flat line for hours 3 through 24 are a characteristic of click spamming. This is what’s happening:
- The clicks are arriving without any human “click-with-intent”, and they cover a large number of devices (doesn’t matter whether it is click spamming, click stacking, or impressions being sold as clicks).
- There are ongoing organic and paid campaigns that are creating installs. Statistically some of these valid installs are contaminated by the spamming.
- However, there is no time-based relationship between the click and install, so the time-to-install trend line shows as flat (missing a defined peak).
Is this fraud?
Certainly this is traffic with significant indications of fraud patterns. However this could also be a click-campaign instrumented as an impression (not expected to create “intent”).
Is it 100% fraud?
Not necessarily, a small portion of the traffic looks to be installs created as a direct result of the ad being served.
Is it actionable?
In this scenario we would recommend reviewing the entire traffic source, unless the pricing was cost-effective, assuming 205 installs were generated (rather than 3,411 installs).
Key takeaway: With click spamming, the recommendation is to pause and review for elimination the fraudulent traffic, rather than just outliers.
Click Injection
Here’s a brief review of click injection timelines (additional details available in part 1 of this blog series).
Organic install starts > malware detects and fires click > install/attribution occurs
or
Paid campaign install starts > malware detects and fires click > install/attribution occurs
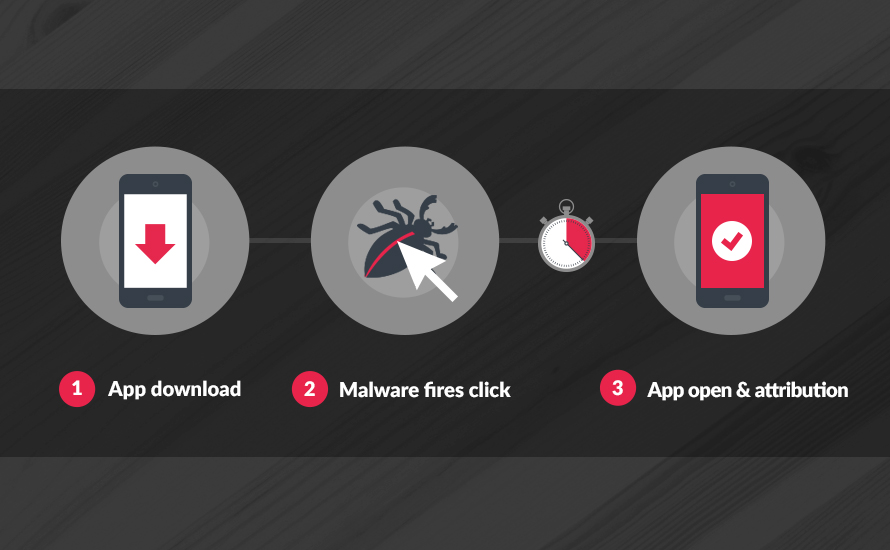
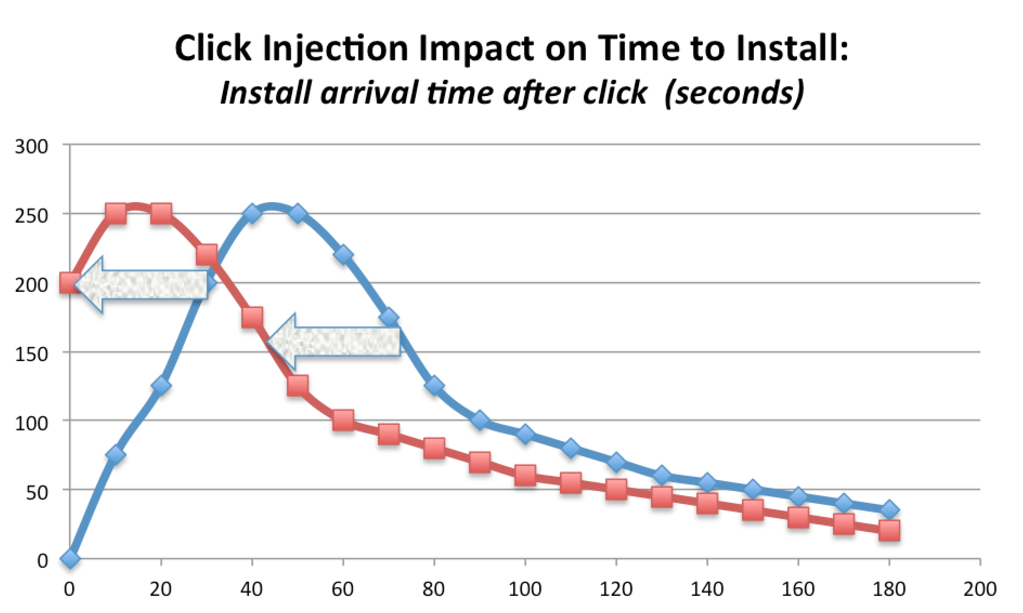
Chart: Time-to-install for click-injection moves the entire curve to the left.
This time-to-install graph shows a normal install trend-line (blue line), and the same traffic source where 100% of that traffic is impacted by click-injections.
Note that click-injection can result in a time-to-install of 0 seconds (or 5 seconds, or 20 seconds), but can also deliver a time-to-install of 120 seconds and beyond.
Key takeaway: Click-injection fraud happens with time-to-install of 0, 100, or 10,000 seconds.
Next is an example of real-world traffic comparing installs attributed to internal sources (no compensation, a.k.a. fraud-free), and traffic heavily impacted by click-injections. There are about 28k installs shown in the click-injection use case and around 25k installs with the fraud-free traffic. This visually demonstrates the impact — that the overall click-injection fraud impacts all of the traffic, not just installs that happen under 10 or 20 seconds.
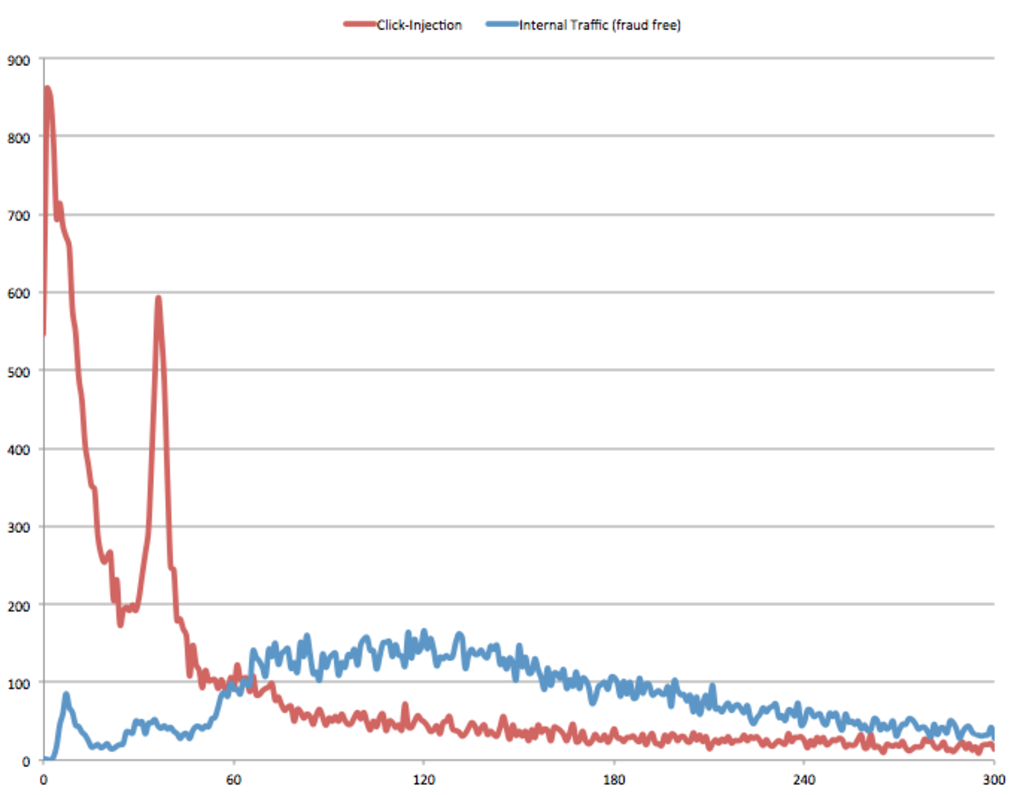
Chart: Real-world comparison of click-injection traffic with fraud-free traffic source.
Outlier processing against this data set could eliminate installs under 10 (or 20 or 30) seconds, but these would all fail to eliminate the vast majority of the fraud.
Is this fraud?
Certainly this is traffic with significant indications of fraud patterns.
Is it 100% fraud?
Some smaller fraction could come from non-fraud sources.
Is it actionable?
In this scenario, we would recommend pausing and reviewing the entire traffic source for possible elimination. While there may be 10% or 20% of the traffic that could come from a non-fraud source, the overall traffic source is dominated by indications of fraud.
Fraud Search With Composite Traffic
One of the core challenges around time-to-install analysis at a partner level is that the traffic will likely show composite behaviors: traffic from high-quality sources blended with traffic from fraudulent sources.
It could be blending between:
- High quality (HQ) sub-publishers + Low quality (LQ) sub-publishers
- HQ country + LQ country
- HQ day/week/time-of-day + LQ day/week/time-of-day
- HQ platform + LQ platform
What is challenging around time-to-install is executing all of the analysis required to make decisions. Breaking down traffic by campaign, sub-publisher, app, country, and time dimension(s) can yield tens of thousands of individual traffic patterns to be evaluated. When the time-to-analysis is measured in weeks or months it becomes increasingly difficult to analyze faster than new fraud sources are coming in.
What is needed is faster analysis and identification of patterns with indications of fraud — i.e. automated search. Next-day analysis is required across all of these dimensions (and more) to clearly find traffic with indications of fraud.
The goal of search is to break down composite traffic into actionable pieces. A conclusion that “it looks like 10% of this traffic has indications of fraud” is far less actionable than breaking down by sub-publisher (for example) and separating the 90% good traffic from the 10% bad traffic, so the bad traffic can be excluded moving forward. Remember to ask yourselves these three key questions:
Is this fraud?
Is it 100% fraud?
Is it actionable?
Automated search enables finding those parts of the traffic that are actionable — i.e. shows clear patterns to enable action.
Key takeaway: Automated Search makes click-fraud identification more powerful and more actionable.
Closing Remarks
At TUNE we talk about “The Lean Marketer,” leveraging the learnings from the The Lean Startup by Eric Ries to enable a model where our marketers can:
Measure Faster > Learn Faster > Change Faster
Automated Search enables measuring faster across relevant dimensions to enable learning faster and changing faster.
Key takeaway: Automated Search, i.e. faster analysis, is key to staying ahead of fraud.
Time-to-install is a tremendous tool for identifying both good traffic and bad. In addition time-to-install demonstrates advertising in action: visual feedback for driving installs.
Key takeaway: Time-to-install can be used to evaluate the incrementality of ad campaigns, i.e. did the ad drive action.
A variety of fraud techniques are clearly identified with time-to-install analysis: Click stacking, spamming, etc. show as clear and distinct patterns indicating fraud (flat line), and Click-injection shows as a clear and distinct pattern indicating fraud (left-shifted install curve).
Key takeaway: Time-to-install analysis coupled with automated search enables measuring, learning, and changing faster to eliminate click fraud.
Look for upcoming announcements from TUNE on Proactive Fraud Prevention, capabilities around automated search to measure and learn faster, as well as levers to enable changing faster.
Author
Becky is the Senior Content Marketing Manager at TUNE. Before TUNE, she handled content strategy and marketing communications at several tech startups in the Bay Area. Becky received her bachelor's degree in English from Wake Forest University. After a decade in San Francisco and Seattle, she has returned home to Charleston, SC, where you can find her strolling through Hampton Park with her pup and enjoying the simple things in life.