One of the consequences of the increasingly competitive mobile app ecosystem is the rising cost of user acquisition. Although the cost of acquiring new users fluctuates, recent data shows that the year-over-year cost per install increased 44 percent for Android apps ($1.27/install) and 16 percent for iOS apps ($1.22/install). Ensuring that your ad spend is appropriately allocated and utilized at the most favorable time is fundamental to driving successful user acquisition campaigns and optimizing your mobile marketing budget.
In an effort to provide insight into the timing of user acquisition campaigns, we conducted a study that examined paid installs associated with more than 1,000 iOS and Android gaming apps in the US over a 13 month period. The primary objective was to measure the performance of install volume and install rates (installs/ad clicks) of the following intervals and events:
- Weekdays vs. Weekends
- Month-by-Month
- Paydays
- Prominent US Holidays
- Major Events
The results of each of these inquiries are discussed in detail below.
Weekday vs. Weekends
The graph below shows the average number of installs (indicated by the shaded vertical blue bars) and the average install rate (indicated by the line graph at the top) for each day of the week.
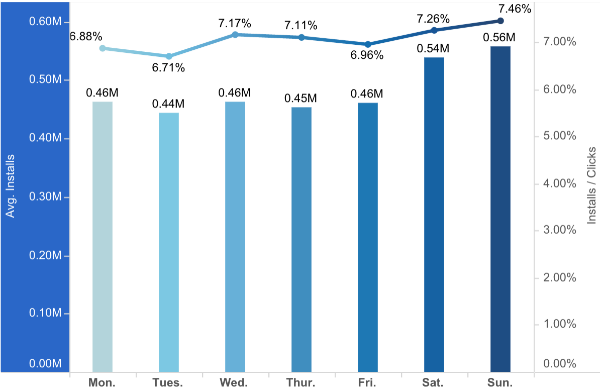
On average, Saturdays and Sundays produce higher install volume. In fact, the average volume on Sundays is a 28 percent increase over the lowest performing day (Tuesdays). In terms of the install rate, it appears that Saturday (7.26%) and Sunday (7.46%) also perform at a slightly higher level, but after some additional analysis, the variabilities in the install rates were found to be too minor for statistical significance. In other words, you can expect to find a similar install rate on weekdays and weekends.
Takeaway: While you will likely see higher volumes on weekends, don’t expect your install rates (install/ad clicks) to improve much when you compare them to weekdays.
Month-by-Month
The graph below illustrates install volume and install rates on a monthly basis. The vertical bars represent the install volume (broken down by season), and the install rate is represented by the line graph.
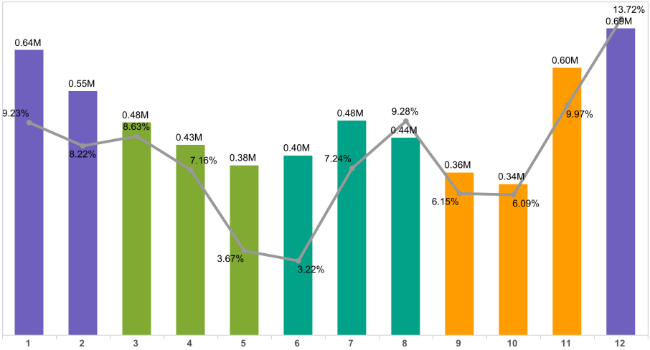
November, December, and January have relatively high install volume and install rates. This is likely influenced by increased holiday activity and perhaps also because people tend to spend more time indoors during these months. Performance during May and June is also worth noting, particularly the install rate for both months which came in at 3.67 and 3.22 percent, well below the monthly average of 7.71 percent.
Takeaway: Late autumn and early winter months have higher install volume and install rates.
Paydays
Over the years we’ve occasionally heard the claim that apps experience a boost in volume on paydays or in the days that immediately follow. The graph below illustrates one of the ways we examined this question. The vertical bars represent the average install volume for each day of the month (i.e. July 1, Aug. 1, Sept. 1, etc. are stacked in bar 1). The blue bars represent the top five performing days, while the orange line represents the install rate throughout the month.
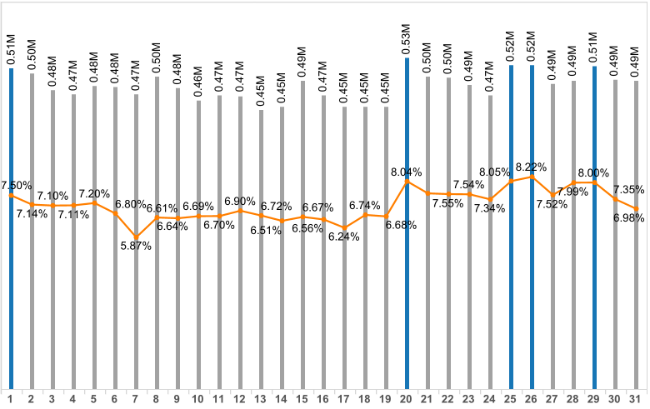
Logically speaking, the payday theory seems to make sense (i.e. an influx in cash increases the likelihood of a user making a purchase). But despite testing numerous payday scenarios, we were not able to make any statistically valid claims regarding paydays.
Takeaway: Install volume and install rate are not affected by paydays.
Prominent US Holidays
US holidays – particularly those in November and December – have a well-established reputation for commerciality, and this characteristic is definitely present in the mobile space. The following graph captures the install volume (vertical bars) and install rates (horizontal lines) of a few prominent US holidays.
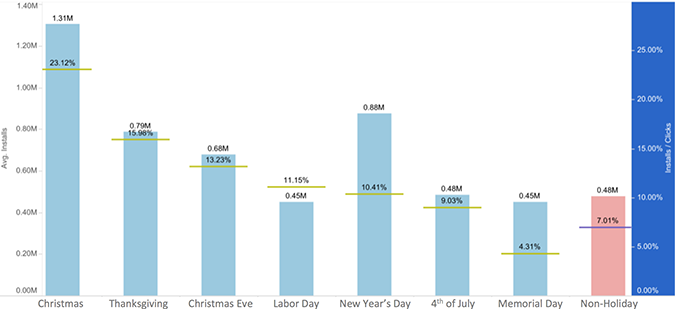
Christmas day is the clear leader in terms of both install volume and install rates. Install volume experienced a173 percent increase over the average non-holiday, and at 23.12 percent, install rates are more than triple the average non-holiday figure. Thanksgiving, Christmas Eve, Labor Day, and New Year’s Day all boast install rates over 10 percent.
Allocating a large portion of ad spend to the holiday season is a common mobile marketing practice – and data like this clearly indicates why. However, it is worth noting that cost per install (CPI) also tends to increase during the holiday season. For example, in September 2013 the CPI for an Android user was $0.75 but increased to $1.54 in December. Before you dedicate a large portion of your budget to the holiday season, be sure you understand your CPI costs and the average revenue per user (ARPU).
Takeaway: On average, holidays drive more installs and have a higher install rate than non-holidays.
Major Events
In addition to the time intervals examined above, we also analyzed the impact major events had on volume and install rates. We looked at data associated with a number of high profile occasions, including sporting events like the World Cup and the Winter Olympics, as well as major tech activities like the release of iPad Air, iPhone 5s, KitKat and others. Despite analyzing the data in a number of different ways, we were not able to draw any significant statistical conclusions about the impact these events had on user acquisition.
In Summary
Using data to inform your user acquisition campaigns is an essential mobile marketing practice. As the mobile marketplace becomes increasingly competitive, considering the timing of your user acquisition campaigns can help optimize your results. Remember, the data we presented here is aggregated from more than 1,000 gaming apps. The performance of your individual apps may not directly correlate with any of the behaviors we identified, but hopefully the graphs and takeaways discussed in this article encourage you to think more about how to improve your own campaigns. The most important takeaway is to understand that data provides valuable insight that can significantly impact campaign performance. Work with your own data, discover the patterns and insights, and use this knowledge to make better marketing decisions.
 This article is part of the Mobile Marketing Essentials series.
Author
Becky is the Senior Content Marketing Manager at TUNE. Before TUNE, she handled content strategy and marketing communications at several tech startups in the Bay Area. Becky received her bachelor's degree in English from Wake Forest University. After a decade in San Francisco and Seattle, she has returned home to Charleston, SC, where you can find her strolling through Hampton Park with her pup and enjoying the simple things in life.