At the bottom of the funnel, it is time for the user to actually make a purchase. See if your app is converting browsers to buyers with these metrics.
Ported Post: This entry was originally published in the Artisan Mobile blog. Artisan was rebranded as In-App Marketing after being acquired by TUNE in July of 2015.
What is the Bottom of the Funnel?
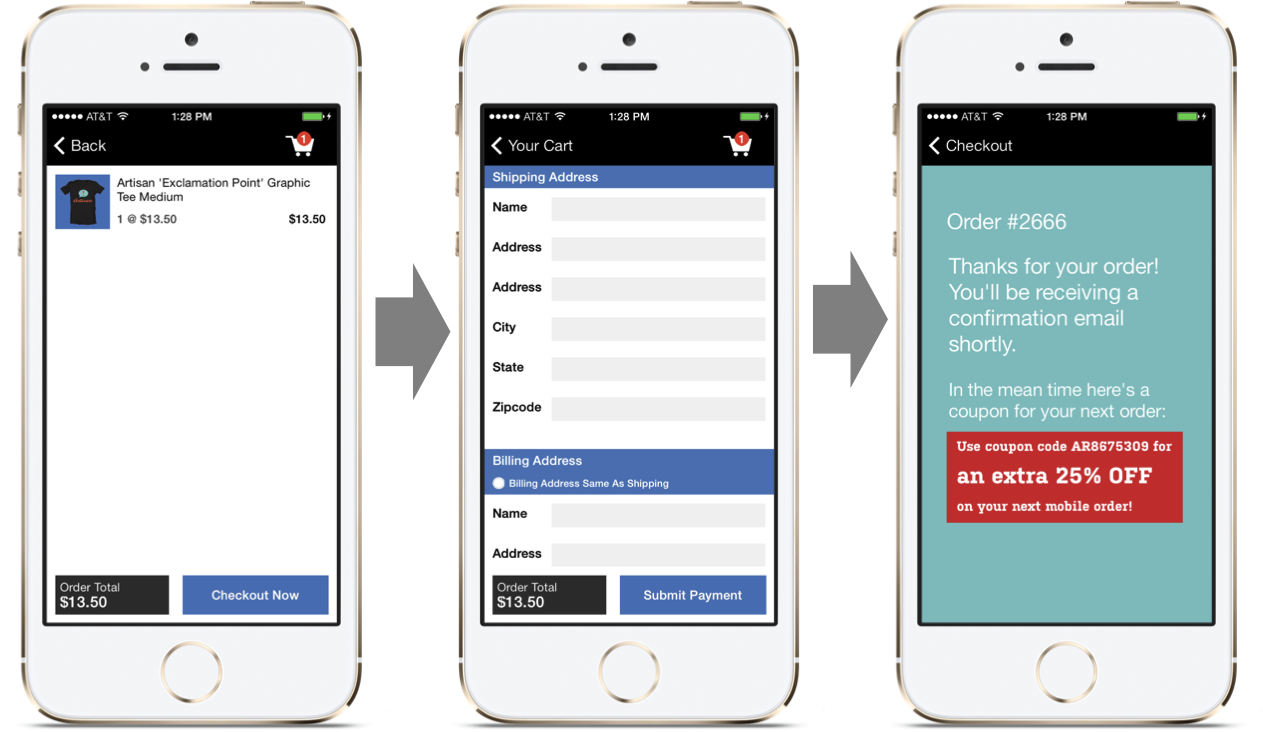
The bottom of the funnel is where all of the buying activity takes place. It’s where browsers become buyers and users become customers. In order to reach this point in the funnel, users have discovered the mobile app, initiated a session where they browsed products and added products to their cart.
At the bottom of the funnel, it is time for the user to actually make a purchase. The user has made a commitment and the checkout flow should make fulfilling this desire as simple as possible. Once the purchase is completed, a well-placed trigger — whether it’s shipping confirmation, simple reassurance, or a targeted offer — can create a positive post-purchase experience and ultimately initiate a loyalty loop which drives repeat purchases.
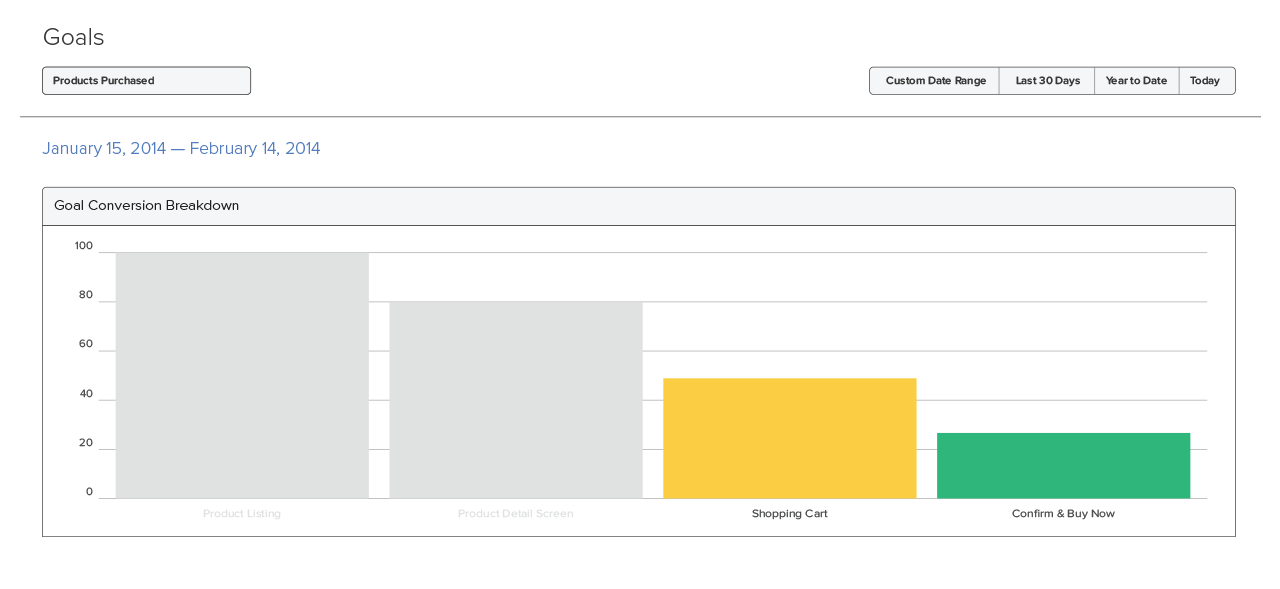
In order to understand the effectiveness of the bottom of the funnel, you must have clarity into what happens after a user adds an item to the cart. Metrics such as “checkout conversion rate” and “cart abandonment rate,” described below can provide the visibility into the final steps of a user’s purchase, or lack of purchase.
- Checkout Conversion Rate – Check out conversion rate is a key metric for understanding bottom of the funnel performance. It is defined as the percentage of transactions that are ultimately purchased after having reached the cart. SmartInsights reported that a checkout conversion rate is typically around 50%. That is, only half of users, who add a product to their cart, when all is said and done, follow through by purchasing the product. A low check out conversion rate signals a poor or overly complex checkout experience. In addition, it may reveal the true intentions of app users and showcase the importance of a multi-platform strategy.
- Cart Abandonment Rate – Representing the other 50% of app users who have placed an item in the cart and opted not to checkout, cart abandonment rate is the evil twin of checkout conversions rate. It is defined as the percentage of transactions that are not ultimately purchased after having reached the cart. Whether the user opted to purchase the product on the web, offline, or not at all, this metric is paramount to fully understanding buying, or non-buying behavior. Similar to the checkout conversion rate, cart abandonment rate can be improved by simplifying an app’s checkout experience.
Successfully identifying and improving these metrics means aligning user experience with prospective customer needs. Better fulfilling these needs means more app revenue.
Looking for testing ideas to help improve these metrics? Download our free eBook.
Author
Becky is the Senior Content Marketing Manager at TUNE. Before TUNE, she handled content strategy and marketing communications at several tech startups in the Bay Area. Becky received her bachelor's degree in English from Wake Forest University. After a decade in San Francisco and Seattle, she has returned home to Charleston, SC, where you can find her strolling through Hampton Park with her pup and enjoying the simple things in life.


Leave a Reply
You must be logged in to post a comment.